- Movies
- Virtual Reality
Multimedia / Animation..........MOVIES
![]()
|
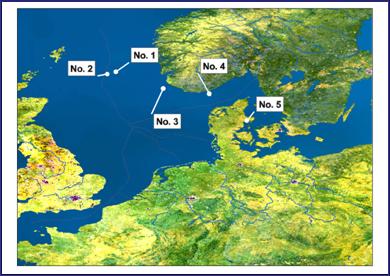
NORTH SEA You will find an overview movie of the North Sea region together with movie clips for No.1 - No.4. A short description about the contents of each movie together with a small overview image is provided. Click on the highlighted video clip text on the right side of each thumbnail image to start the movie. |
No.1 No.2a No.2b No.3 No.4 |
 |
| Overview |
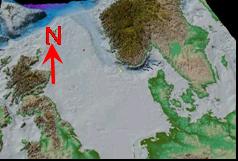
From this film clip with 30-fold vertical exxageration you get an impression of the morphological features of the North Sea and its adjacent areas. The red pyramid in the North Sea denotes the region of the sites shown at No. 1 and 2. The yellow line in the Norwegian Trench marks the position of a part of a pipeline route (EUROPIPE II) along which microbathymetrical data has been collected. This part of the pipeline crosses the area with intense pockmark occurrences. Black lines in the Skagerrak give the positions of geological profiles taken from literature sources. The red pyramid in the Kattegat region denotes the position of the study area in Aarhus Bay (Denmark). Your "flight" starts over the European continental mainland and continues in Northward direction over the British Isles. With a right hand bend over the Faroe Islands along the European continental margin at the Northern North Sea the route in Southern direction follows the Norwegian Trench and stops in the Central North Sea with a look towards Denmark, the Kattegat and the Western Baltic Sea |
| North Sea - Overview (System Requirements) | |||||
| No. 1 |
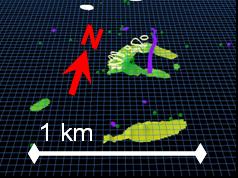
Site within Block 25/7, Norwegian Sector. The distribution of free gas in the subsurface together with seafloor features (carbonates) are shown. The seafloor is very even therefore an artificial grid was added to the scene in order to enhance the spatial imagination. Legend: in green and orange = surface of gas zone (Top of Gas) modeled with data from depth measurements (gas beneath the seafloor), colour depends on depth interval, violet = buried channels (stretched band comprises the outline of a detected channel, approx. 3m below the seafloor, dots mark position where channel structures have been detected but no outline could be created), light coloured areas = "only outline" gives locations of calcium carbonates at the surface, "full-coloured areas" beneath are artificially draped over the surface of the gas to see whether there are certain characteristics on the gas surface that match up with the carbonate occurrences |
| Block 25/7 (System Requirements) | |||||
| No. 2a |
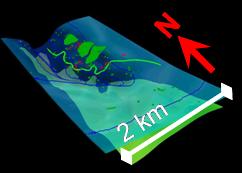
Block 25/6, Norwegian Sector, site is called "Holene" . Two clips are offered: a) Overview "flight" around the site. The site shown in the model has an extent of 2 x 4 km. The seafloor surface is shown in light blue with dark blue depth contour lines. The even seafloor surface lies in 120m water depth, the depression reaches water depth up to 145m. The vertical exaggeration is 25-fold. Green and yellow colours beneath the seafloor represent the modeled Top of the zone with free gas occurrence (see description of No. 2b for more information). The dark green line symbolises the boundary of acoustic blanking, dark green dots represent pockmarks and red lines are recognised seabed faults. The dark green areas on the seafloor surface mark locations where free gas has been detected in a survey that followed the one on which this model is based on. In addition to bathymetrical and seismic surveying (leading to information about the seafloor bathymetry and the recognition of free gas) visual inspections of the seabed with a Remotely operated vehicle (ROV) and sampling of sediments have been carried out to gather the information compiled here. |
| Holene_Overview (System Requirements) | |||||
| No. 2b |
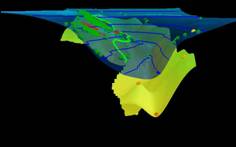
"Holene", b) a "flight" diving into an East-West profile of the site with a closer look at the relationship between bathymetry and gas depth. Legend: orange dots mark the positions of depths measurements (Top of Gas beneath the seafloor), with these information the surface of the gassy area was modeled, blue = bathymetry (seafloor surface) yellow = surface of gas horizon (Top of Gas) |
| "Dive Into"-Holene (System Requirements) | |||||
| No. 3 |
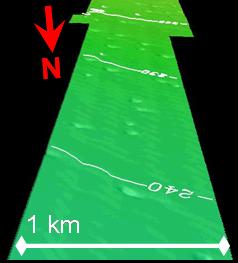
Seabed inspection surveys along the track of pipeline EUROPIPE II (see also the Overview clip) gathered information about the seafloor morphology in high resolution. In the region of the Western flank of the Trench the high abundance of pockmarks was already known but here the spatial relationships of single pockmarks as well as their individual shape can be examined. With this data it is possible to resolve single pockmarks and other seabed features (like iceberg scours). The bathymetrical data for the described leg of EUROPIPE II was converted into a digital format and displayed in three-dimensions. Therefore the film resembles a true "flight" over the seabed at the Western Norwegian margin but is created as virtual reality. The flight starts at the bottom of the Norwegian Trench at 330m water depth and continues in Southward direction until the shallow plateau of the North Sea with marked iceberg groove marks at water depths of about 135m is reached. The horizontal distance from start to end of the track is 80 km. The impression of "uphill" movement in virtual reality is suppressed for this clip in order to keep the file as small as possible. Different colours correspond to the water depths and help to "feel" the changes in the bathymetry. |
| "Flight" over EUROPIPE II (System Requirements) | |||||
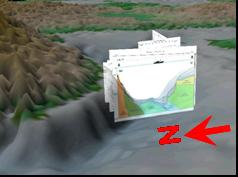
| No. 4 | Charts with geological profiles for the region of the Skagerrak have been collected from literature sources and positioned there where they occur in the real world. The "flight" through the profiles in combination with a Digital Elevation Model (DEM) of the European surface gives an idea about spatial relationships of geological strata and the actual morphology. The bathymetrical data information for the DEM and the charts appeared to be different, therefore a 100% match of profile and DEM was not possible. |
| Geol. Profiles Skagerrak (System Requirements) |