- Movies
- Virtual Reality
Multimedia / Animation..........VIRTUAL REALITY
![]()
|
Compilations of data in 3D have been saved in Scene-files which can be used with the viewer "fledermaus-iVIEW-3D" by "Interactive Visualization Systems (IVS 3D, Canada)". Get this freeware via the internet from the homepage of the supplier to assure full support and the actual version of the software. Install the software on your computer, it will take only few minutes. Then download the scene files offered on this page to your computer and open them with your iVIEW-3D. Quick iView-3D Help PLEASE NOTE: We kindly ask for referring to the METROL project if you use these files for your own purposes in the public. METROL is still keeping the proprietary rights after the download by non-METROL persons. |
 |
|
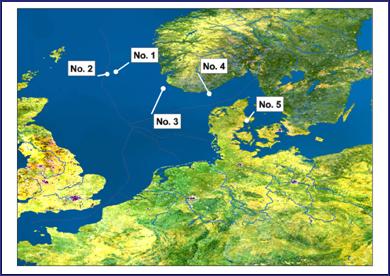
NORTH SEA and Aarhus Bay Scene-files for interactive inspection of sites in virtual reality. A short description about the contents of each scene together with a small overview image is provided (= analogous to the Movie-page). Click on the highlighted text on the right side of each thumbnail image to start the download of a scene file for later use on your computer launched with the freeware of iVIEW-3D (see above). DOWNLOAD - IMPORTANT NOTE: The *.scene files are offered in zip-version to keep the file small and to enable the delivery via the internet. Please unzip before use and check whether the unzipped file(s) carry the ending ".scene". |
No.1 No.2 No.3 No.4 No.5 |
 |
| Overview |
We are not offering a stand-alone file for an overview of the North Sea region and its adjacent areas, but the scene for Holene (No. 2) is incorporated in an overview scene. Please use this file. |
| Overview in scene "Holene" | |||||||
| No. 1 |
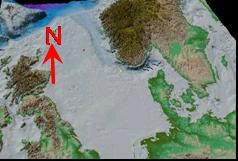
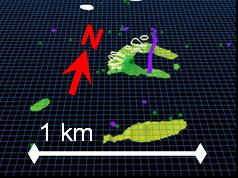
Site within Block 25/7, Norwegian Sector. The distribution of free gas in the subsurface together with seafloor features (carbonates) are shown. The seafloor is very even therefore an artificial grid was added to the scene in order to enhance the spatial imagination. Legend: in green and orange = surface of gas zone (Top of Gas) modeled with data from depth measurements (gas beneath the seafloor), colour depends on depth interval, violet = buried channels (stretched band comprises the outline of a detected channel, approx. 3m below the seafloor, dots mark position where channel structures have been detected but no outline could be created), light coloured areas = "only outline" gives locations of calcium carbonates at the surface, "full-coloured areas" beneath are artificially draped over the surface of the gas to see whether there are certain characteristics on the gas surface that match up with the carbonate occurrences |
|
 Download:
Block 25/7 - ZIP (0,5MB) (463kb) Download:
Block 25/7 - ZIP (0,5MB) (463kb) | |||||||
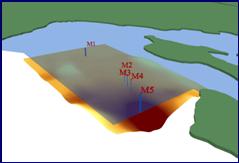
| No. 2a |
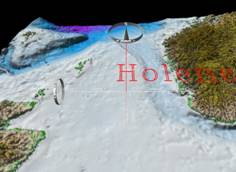
Block 25/6, Norwegian Sector, site is called "Holene". The file is incorporated in an overview scene of the whole North sea region and its adjacent areas. The site "Holene" shown in the model has an extent of 2 x 4 km. Right click at the intersection of the red bar with the seafloor to center the view for further zoom into the site. The seafloor surface is shown in light blue with dark blue depth contour lines. The even seafloor surface lies in 120m water depth, the depression reaches water depth up to 145m. Green and yellow colours beneath the seafloor represent the modeled Top of the zone with free gas occurrence. The dark green line symbolises the boundary of acoustic blanking, dark green dots represent pockmarks and red lines are recognised seabed faults. The dark green areas on the seafloor surface mark locations where free gas has been detected in a survey that followed the one on which this model is based on. Orange dots mark the positions of depths measurements (Top of Gas beneath the seafloor), with these information the surface of the gassy area was modeled, In addition to bathymetrical and seismic surveying (leading to information about the seafloor bathymetry and the recognition of free gas) visual inspections of the seabed with a Remotely operated vehicle (ROV) and sampling of sediments have been carried out to gather the information compiled here. |
|
Download:
Holene - ZIP (2,5MB) (2505kb) | |||||||
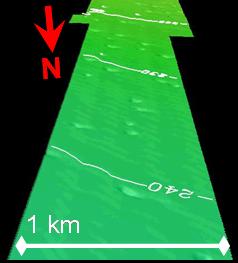
| No. 3 | Seabed inspection surveys along the track of pipeline EUROPIPE II (see also the Overview Movie clip) gathered information about the seafloor morphology in high resolution. In the region of the Western flank of the Trench the high abundance of pockmarks was already known but here the spatial relationships of single pockmarks as well as their individual shape can be examined. With this data it is possible to resolve single pockmarks and other seabed features (like iceberg scours). The bathymetrical data for the described leg of EUROPIPE II was converted into a digital format and displayed in three-dimensions. |
|
Download:
Pockmarks/EUROPIPE II
(6,5MB) (6469kb) | |||||||
| No. 4 |
Charts with geological profiles for the region of the Skagerrak have been collected from literature sources and positioned there where they occur in the real world. The "flight" through the profiles in combination with a Digital Elevation Model (DEM) of the European surface gives an idea about spatial relationships of geological strata and the actual morphology. The bathymetrical data information for the DEM and the charts appeared to be different, therefore a 100% match of profile and DEM was not possible. //Due to exchange problems with the large file format this download is enabled at the moment. |
| Download enabled ! | |||||||
| No. 5 |
METROL study area Aarhus Bay (Denmark) at the Kattegat region. Public data of the area is offered together with general information about coastlines and bathymetry. //Due to exchange problems with the large file format this download is enabled at the moment. |
| Download enabled ! |